How is Population-based Income Distributed Across PhysNets?

The views and material presented here are not endorsed by any funders or collaborators of Health Commons Solutions Lab. This summary is based on our review of data posted online by the Ontario Community Health Profiles Partnership. It does not reflect the views of the Ontario Ministry of Health or the Institute for Clinical Evaluative Sciences.
What’s new?
The Ministry of Health is using a methodology developed by Institute for Clinical Evaluative Sciences (ICES) Scientists Dr. Therese Stukel and Dr. Rick Glazier, called Physician Networks (PhysNets) to attribute patients in Ontario to Ontario Health Teams (OHTs) based on natural utilization and referral patterns between primary and acute care. Until now, very few sociodemographic indicators have been reported on OHT attributed populations. Researchers at the MAP Centre for Urban Health Solutions who lead the Ontario Community Health Profiles Partnership (OCHPP) have recently posted data looking at the income distribution among patients attributed to each PhysNet.
Why does this matter?
OHTs present a unique opportunity for the health system to form and solidify partnerships outside of the traditional sector (e.g. community social services, advocacy groups, housing, public health, municipalities, etc.) by working on initiatives that address upstream determinants of health. This is vitally important because we know that at least 50% of health is determined by social and economic factors. Any actions to improve health and tackle health inequity must address the social determinants and their impact on daily life.
We also know that “the poorer you are in Ontario, the less likely you are to get quality health care”. Research shows that people living in low-income neighbourhoods often have lower rates of screening for cancers, less access to prescription medication insurance, and higher rates of emergency department readmission for mental health issues. Combining income with health data paints a necessary picture for OHTs to ensure that improvements made in integrating and improving care are shared across all socioeconomic groups, and not just concentrated amongst the best-off communities.
How was it done?
You’ll remember that PhysNets are a way of linking patients to a single “usual care provider,” and then assigning that provider’s patients to a hospital (or network of hospitals) based on historic patterns in accessing care. Using this methodology, nearly every patient with a valid health card1 in Ontario is assigned to a single PhysNet.
It is important to remember that while PhysNets are being “mapped” to OHTs by the Ministry, they do not always have a 1:1 correlation with each OHT – in other words, some OHTs are a combination of multiple PhysNets while others may be related to a single PhysNet. We use the PhysNet names here, as reported by the researchers at ICES.
To link income data to PhysNets, the researchers used an area-based analysis. While this makes things harder to explain, it’s necessary in Ontario because we do not have individual income data within our health data. In other words, when you renew your health card, we don’t ask you how much money you make.
Here’s how the analysis works: Each individual is matched to a geographic area defined by Statistics Canada based on the postal code from their health card. Statistics Canada assigns an ‘income quintile’ value to every geographic area based on data collected as part of the Census where we ask households how much money they made last year. The income quintiles range from 1 (lowest income areas) to 5 (highest income areas).
Still with us? Researchers then counted how many individuals within a given PhysNet had an income quintile value of 1 through 5. To enable comparisons across PhysNets, they then created a proportion of the population within each quintile by dividing the count by the total number of people attributed to each OHT.
The details for how income quintile values are assigned by Statistics Canada are even more complicated (see technical Q&A below) but what’s important to remember is that income quintiles should only be interpreted as a relative measure of the distribution of income and should not be interpreted as an absolute measure of poverty. For example, if we look at the Guelph PhysNet, we can say 19% of the people attributed to that network lived in areas that had a median income in the lowest 20% of all areas in Ontario. But we cannot say 19% of people attributed to this PhysNet live below the low-income measure.
Here’s a visual that explains what we mean:

You can access the full data from the OCHPP website including the data table and a series of maps they have created.
What does the data tell us?
We reviewed the data and created some visualizations to help you comb through it quickly.
Here’s what we found:
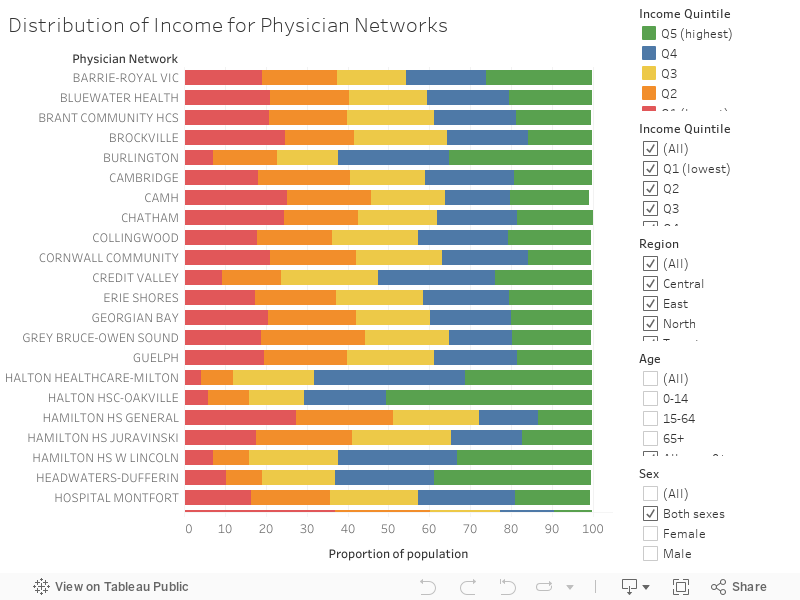
Variation across networks: There is a large range in distribution of income across PhysNets. When looking at the lowest income quintile (Q1), the proportion of the population ranged from 4% in ‘Halton Healthcare-Milton’ compared to 60% in ‘Weeneebayko’. As similar trend was observed when comparing the highest income quintile (Q5) - 5% in ‘Weeneebayko’ compared to 54% in ‘Halton HSC-Oakville’.
Stratifying by region: When comparing the proportion of the population the lowest income quintile (Q1)…
North Region – ‘’Weeneebayko’ had the highest proportion (60%) compared to ‘Sudbury’ with the lowest proportion (20%).
East Region – ‘Scarborough-General’ had the highest proportion (35%) compared to ‘Lakeridge Health – Ajax’ with the lowest proportion (9%).
West Region – ‘Hamilton HS General’ had the highest proportion (27%) compared to ‘Burlington’ with the lowest proportion (7%).
Central Region – ‘Humber-Wilson’ had the highest proportion (37%) compared to ‘Halton Healthcare-Milton’ with the lowest proportion (4%).
Toronto – ‘Toronto East General’ had the highest proportion (34%) compared to ‘Sick Kids’ with the lowest proportion (16%).
Stratifying by sex: When comparing the Physician Networks, there were no major differences by sex.
Stratifying by age group: Similar trends were observed for the population aged 0-14 and 15-64. However, among those aged 65+, PhysNets with hospitals located in rural communities (‘Pembroke’ and ‘North Bay’) had a higher proportion of the population in Q1 compared to two Toronto Physician Networks (‘Toronto East Gen’ and ‘Scarborough-General’).
What do you see when you look at the visualizations? Tweet us at @health_commons!
We are particularly interested in how you see yourself using this data in planning for your OHT. What are the big unanswered questions that you need data to solve?
Have more technical questions?
We did too – so we asked the experts. Here’s what they had to say!
Q: Does one Physician Network = one Ontario Health Team? Why are the names different? How did the Ministry decide which PhysNets to combine?
A: OHT applicants were “mapped” to one or more of the PhysNets based on the scope of their partnerships. Some of this mapping was straightforward – e.g., in those cases where the OHT included hospital and physician partners aligned to the same network, the OHT would be in high alignment with the PhysNet.
Although there were instances in which there were multiple OHTs in one PhysNet or the OHT spans multiple PhysNets - there was still a high degree of alignment between PhysNets and OHTs, since the mapping was based on the providers involved in each OHT.
In instances where an OHT had many partners across multiple PhysNets, the Ministry combined those networks.
Please note that PhysNet names were created by ICES to indicate where each network is located in Ontario. These names are not an indication of what the OHTs are called or should be called.
Q: How are patients linked to Physician Networks?
A: Ontario residents are not connected to a PhysNet based on where they live, but rather on how they access care.
The patient attribution model uses health card information to assign individuals to a physician. More specifically, patients are assigned to the physician they are rostered with or from whom they receive most of their care. Physicians are aligned to the hospital where the majority of their patients are admitted for non-maternal medical care.
Those individuals who have not had any health system interactions over the past three years are considered “non-users” and are attributed to networks based on their postal codes. For more information, see this blog we wrote summarizing the methodology.
Q: How was the income data linked to PhysNets?
A: Researchers used the PCCF+, a Canada Post file, to associate each individual to a geographic area (dissemination area or DA) as defined by Statistics Canada for the Census. They then assigned each individual the corresponding income quintile value based on the geographic area they have been assigned to.
Q: How are income quintile values assigned to geographic areas?
A: As part of the Census, Statistics Canada asks everyone what their before tax household income is. These data are matched to geographic areas and used to calculate the median income per geographic area (dissemination area).
Statistics Canada then ranks each geographic area from lowest to highest median income and divides the geographic areas into five equal sized groups called quintiles. Quintile groupings are adjusted so that each quintile has approximately the same population count. For example, in Ontario, each quintile has approximately 2.7 million people. Keep in mind that median income is adjusted for household size (to estimate the single person equivalent) and for rurality (by comparing DAs to others in the same Census metropolitan area or census agglomeration). For more information on using area-level equity data from the PCCF+, see this resource.
It should also be noted that a recent study found that agreement between individual- and area-level income measures (like income quintiles) is low. The researchers recommended that area-level income measures not be used for a proxy for individual-level income, but rather only for describing socioeconomic inequities for the purpose of assessing the health of an area or population.
Q: Is the lowest income quintile the same as the low-income measure or cut-off (“living below the poverty line”)?
A: Although people in the first quintile (Q1) have the lowest income in the province, a low quintile rank does not necessarily mean that person is considered ‘low-income’ based on the cut-off points used by Statistics Canada such as the Low-Income Measure or Low-Income Cut-Off. However, it is safe to assume there would be some correlation between the lowest income quintile and these measures of low-income.
The income quintile measure is used for this analysis because it allows us to see patterns in how income is distributed at a population-level within and between PhysNets.
Q: When is this data from? Can I use this data to monitor changes over time?
A: The data come from three different sources: the Postal Code Conversion File + (Canada Post, 2017), Registered Persons Database (ICES, 2018), and PhysNet attributions (ICES, 2015-2017). Currently, these data do not allow us to observe trends over time but can be updated in a few years for us to compare. It will be important to remember that the patients attributed to a PhysNet will change over time as patients naturally change their access and utilization patterns – so multi-year comparisons will be tricky.
Q: Can I compare my PhysNet to another? What do I need to remember when doing so?
A: The income distribution of a particular PhysNet can be compared relative to other PhysNets using the ‘proportion of the population’ (rather than count of population). This is important because PhysNets are highly variable in population size. When comparing PhysNets, make sure to take into account the variation in population size as well as geographic proximity. In other words, it makes most sense to compare a particular PhysNet to one of comparable population size in a similar geographic region of Ontario (e.g. comparing two PhysNets with hospital locations in the Greater Toronto Area to each other, rather than to a PhysNet with a smaller population and a hospital location in Northern Ontario).
Q: Isn’t there natural geographic variation in income across Ontario? Doesn’t the cost of living vary?
A: Yes, there is geographic variation in socioeconomic status across the province that is largely a function of the cost of living in various communities. To account for this, Statistics Canada adjusts for rurality when determining the income quintile values so that it makes sense to compare areas, for example, from Toronto to Thunder Bay.
They do this by calculating the income quintile values separately within each Census Metropolitan Area (CMA), Census Agglomeration (CA) or in ‘residual areas’ within Ontario that are outside these areas (more rural areas). The population is then weighted for each area so that the ranking includes approximately 20% of the population in each quintile. The separate rankings for each ‘area’ are then pooled to create a ranking that is provincially consistent and suitable for relative comparison because it accounts for local variation.
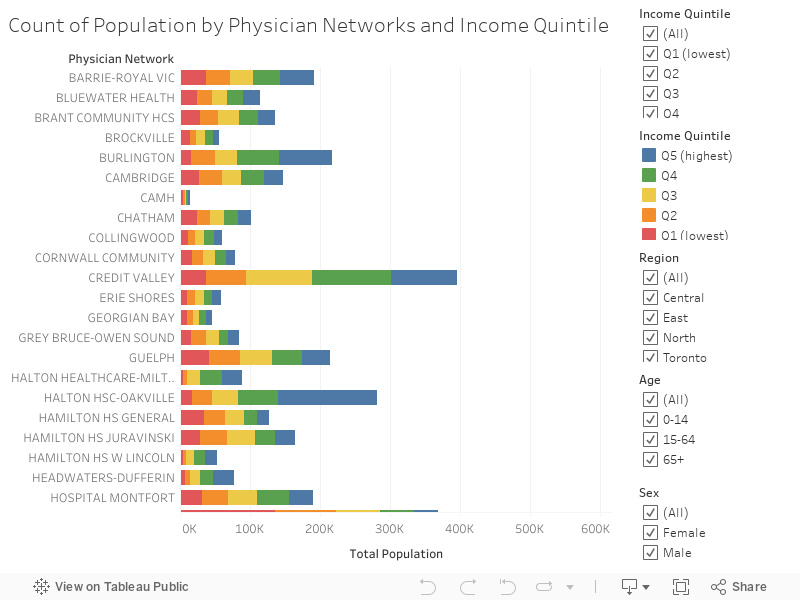
Q: Should I use the count or the proportion when looking at this data?
A: Counts are useful for understanding the volume of patients who may be accessing services in each PhysNet. Counts can be used by OHTs to quantify the absolute number of individuals who fall in a given income quintile, which can be very useful when planning programs and services. For example, in the Guelph PhysNet, there are 9,608 people over the age of 65 who fall in the lowest income quintile. This information can be useful when designing services for older adults that take into account the social determinants shaping the health of this group.
For more information, on this blog or how to use the visualization tools, send us a note at www.healthcommons.ca/contact. For technical questions about this analysis, contact the OCHPP team.
Footnotes
[1] A small percent of patients (less than 1%) could not be linked to a Physician Network because they had received no ambulatory physician services over the past 3-year period. Also keep in mind that people without valid health cards are not included in these data.
References
Stukel, T. A., Glazier, R. H., Schultz, S. E., Guan, J., Zagorski, B. M., Gozdyra, P., & Henry, D. A. (2013). Multispecialty PhysNets in Ontario. Open Medicine, 7(2), e40.
Ontario Community Health Profiles Partnership. (2020). Ontario Community Health Profiles.
Ontario Community Health Profiles Partnership. (2020). Ontario Physician Networks Data
Health Quality Ontario. (2016). Income and Health: Opportunities to achieve health equity in Ontario.
Senate Subcommittee on Population Health. (2009). A healthy, productive Canada: A determinant of health approach.
Buajitti, E., Chiodo, S., & Rosella, L. C. (2020). Agreement between area- and individual-level income measures in a population-based cohort: Implications for population health research. SSM - population health, 10, 100553. https://doi.org/10.1016/j.ssmph.2020.100553